Precision和Recall是两个矛盾的度量,一个变大时,另一个就变小。怎样格式化P-R的关系呢。P-R曲线。
绘制P-R曲线
根据每一个样本得到不同的分类平面,即许多个不同的模型。对每一个模型计算P&R值,最后以P,R为横纵轴绘图。
1. 如何得到不同模型
图示
假设已经使用训练样本训练出一个Logistic Regression模型log_reg,测试集x_test,y_test。调用训练好模型的decision_function(),返回所有分类平面。其实Logistic Regression的默认分类平面是y=0,即threshold=0。
decision_scores记录所有分类平面:
1
2
3
4
| decision_scores = log_reg.decision_function(x_test)
print(len(decision_scores))
print(np.min(decision_scores))
print(np.max(decision_scores))
|
当threshold = 0时,即默认分类平面对应的模型各指标:
1
2
3
4
5
| y_predict = log_reg.predict(x_test)
print(confusion_matrix(y_test, y_predict))
print(precision_score(y_test, y_predict))
print(recall_score(y_test, y_predict))
|
当使用threshold = -5为分类平面时,三指标:
1
2
3
4
5
6
|
y_predict_m5 = np.asarray(decision_scores >= -5, dtype='int')
print(confusion_matrix(y_test, y_predict_m5))
print(precision_score(y_test, y_predict_m5))
print(recall_score(y_test, y_predict_m5))
|
相较threshold = 0的模型,P下降,R上升。
当使用threshold = 5为分类平面时,三指标:
1
2
3
4
5
6
|
y_predict_5 = np.asarray(decision_scores >= 5, dtype='int')
print(confusion_matrix(y_test, y_predict_5))
print(precision_score(y_test, y_predict_5))
print(recall_score(y_test, y_predict_5))
|
相较threshold = 0的模型,P上升,R下降。
2. 绘制曲线
得到每一个threshold对应的P,R值,绘制P-R曲线。
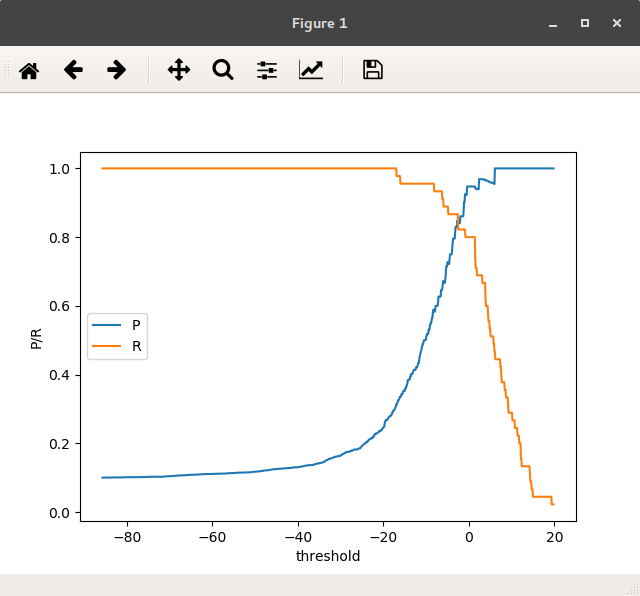
有了对某一个threshold的理解,现在相隔0.1取一个threshold,获得所有P,所有R:
1
2
3
4
5
6
7
8
9
10
11
| import matplotlib.pyplot as plt
precisions = []
recalls = []
thresholds = np.arange(np.min(decision_scores), np.max(decision_scores), 0.1)
for threshold in thresholds:
y_predict = np.array(decision_scores >= threshold, dtype='int')
precisions.append(precision_score(y_test, y_predict))
recalls.append(recall_score(y_test, y_predict))
|
绘图thresholds vs precisions和thresholds vs recalls:
1
2
3
4
5
6
| plt.plot(thresholds, precisions, label='P')
plt.plot(thresholds, recalls, label='R', )
plt.legend(loc='center left', prop={'size': 10})
plt.xlabel('threshold')
plt.ylabel('P/R')
plt.show()
|
结果:
图 不同threshold的P/R值
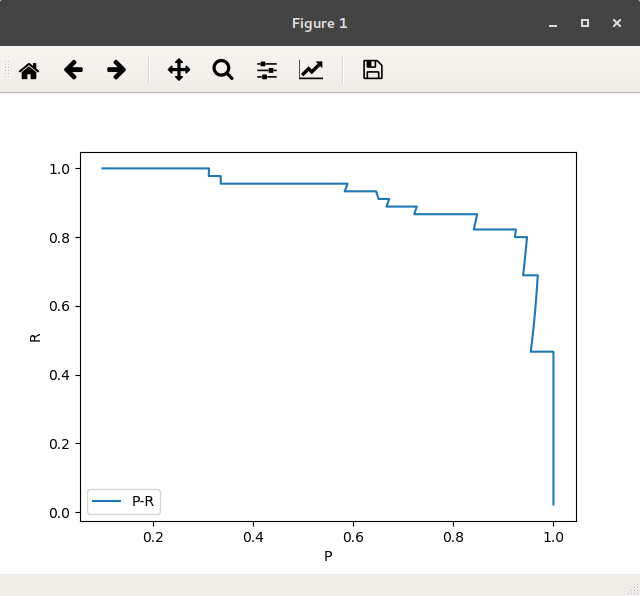
绘制precision vs recall:
1
2
3
4
5
| plt.plot(precisions, recalls, label='P-R')
plt.legend(loc='lower left', prop={'size': 10})
plt.xlabel('P')
plt.ylabel('R')
plt.show()
|
结果:
图 P/R曲线
敲黑板经过实验得出:
- 最优threshold基本都在0附近,因此可以说,若没有对某一指标有具体的定量要求,只用判别
threshold=0时的指标就可以对整个模型的性能进行评估了。
- 第二点,一个二分类模型尝试移动分类平面,可以得到对于P&R不同重视程度的模型。
对于P-R曲线的几点补充:
- 实际中,对P-R曲线进行平滑操作
- 如果由若干个模型的P-R曲线在同一个图中,如何判断哪个最优。
- 看哪一个曲线把其他的“包住”
- 比较每条曲线与坐标轴围成的面积
附件
sklearn package中的绘制P-R曲线的方法:
1
2
3
4
5
6
7
8
9
10
| from sklearn.metrics import precision_recall_curve
pres, recs, thrs = precision_recall_curve(y_test, decision_scores)
plt.plot(thrs, pres[:-1], label='thr-P')
plt.plot(thrs, recs[:-1], label='thr-R', )
plt.legend(loc='center left', prop={'size': 10})
plt.xlabel('threshold')
plt.ylabel('P/R')
plt.show()
|
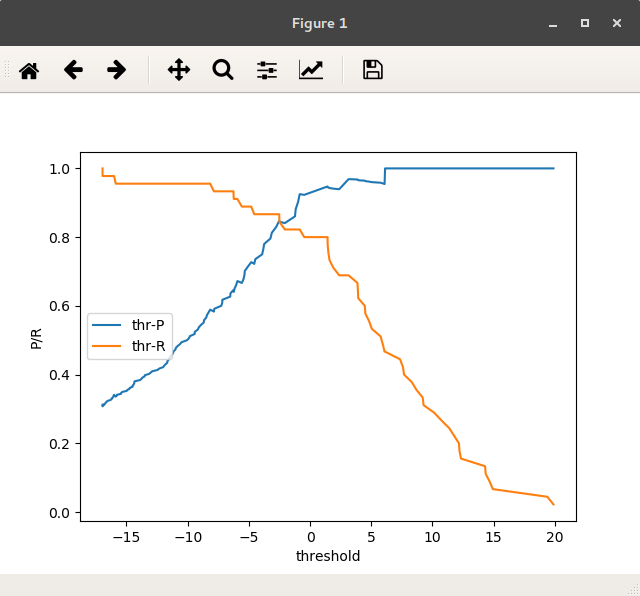
不同threshold的P/R值:
图 不同threshold的P/R值 built-in方法
与上述实现不同在于,上述实现的threashold值从decision_scores的最小值到最大值,而package中函数把threshold值小于-18的值忽略未记,因为图一中这部分对于用户是没有决策贡献的。抓住要矛盾。
1
2
3
4
5
| plt.plot(pres, recs, label='P-R')
plt.legend(loc='lower left', prop={'size': 10})
plt.xlabel('P')
plt.ylabel('R')
plt.show()
|
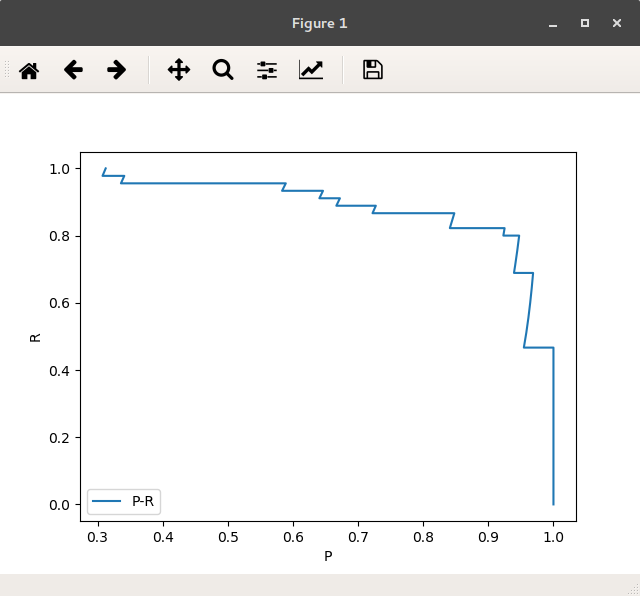
P/R曲线
图 P/R曲线 built-in方法


