对于线性不可分而非线性可分的数据,也可以使用线性SVM。只需要将数据转换为高维的含有多项式项的数据。
数据集
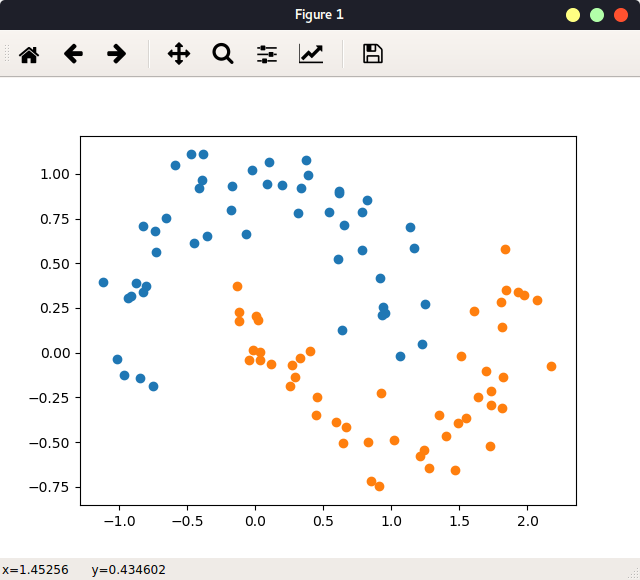
先找一个,分线性可分数据集:
1
2
3
4
5
6
7
8
| from sklearn import datasets
x, y = datasets.make_moons(noise=0.15, random_state=11)
plt.scatter(x[y==0, 0], x[y==0,1])
plt.scatter(x[y==1, 0], x[y==1,1])
plt.show()
|
结果:
图 待处理数据
含多项式特征的LinearSVM
指定多形式的阶数,将数据转化成高维的含有多项式项数据,后传入LinearSVM:
1
2
3
4
5
6
| def PolynomialSVC(degree, C=0.1):
return Pipeline([
("Poly", PolynomialFeatures(degree=degree)),
("standard", StandardScaler()),
("LinearSVC", LinearSVC(C=C))
])
|
使用Pipline可以顺序执行各部分。实例化模型,并查看模型信息:
1
2
3
| poly_svc = PolynomialSVC(3)
poly_svc.fit(x, y)
print(poly_svc)
|
模型信息:
1
2
3
4
5
| Pipeline(memory=None,
steps=[('Poly', PolynomialFeatures(degree=3, include_bias=True, interaction_only=False)), ('standard', StandardScaler(copy=True, with_mean=True, with_std=True)), ('LinearSVC', LinearSVC(C=0.1, class_weight=None, dual=True, fit_intercept=True,
intercept_scaling=1, loss='squared_hinge', max_iter=1000,
multi_class='ovr', penalty='l2', random_state=None, tol=0.0001,
verbose=0))])
|
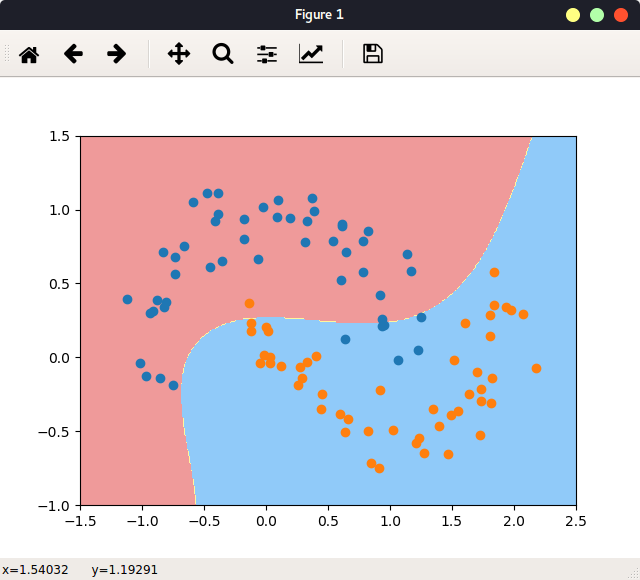
绘出分类边界:
1
2
3
4
| plot_decision_boundary(poly_svc, axis=[-1.5, 2.5, -1.0, 1.5])
plt.scatter(x[y==0, 0], x[y==0,1])
plt.scatter(x[y==1, 0], x[y==1,1])
plt.show()
|
结果为分线性边界:
图 分类边界
多项式核函数
SVM可以直接使用数据的多项式特征,即多项式核函数,所以使用SVC而非LinearSVC。此时Pipline中不需先得到多项式特征:
1
2
3
4
5
6
7
| from sklearn.svm import SVC
def Polynomial_KernelSVC(degree, C=0.1):
return Pipeline([
("standard", StandardScaler()),
("kernelSVC", SVC(kernel="poly", degree=degree, C=C))
])
|
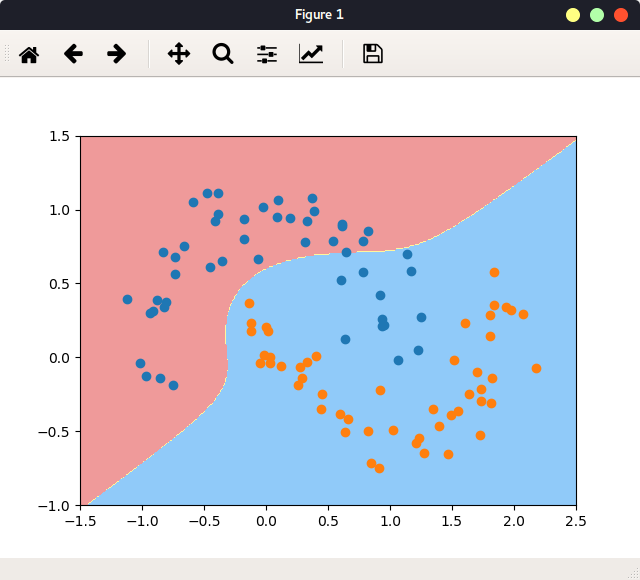
传入kernel参数,指定使用什么样的核函数。实例化模型,绘制分类边界:
1
2
3
4
5
6
7
| poly_kernel_svc = Polynomial_KernelSVC(degree=5)
poly_kernel_svc.fit(x, y)
plot_decision_boundary(poly_kernel_svc, axis=[-1.5, 2.5, -1.0, 1.5])
plt.scatter(x[y==0, 0], x[y==0,1])
plt.scatter(x[y==1, 0], x[y==1,1])
plt.show()
|
边界:
图 使用多项式核函数的分类边界


